
OEE
OEE software
Measure availability, performance and quality from real production bookings, and find out where machine time actually goes instead of arguing about it.
Definition
What is OEE software?
OEE software calculates overall equipment effectiveness: availability multiplied by performance multiplied by quality. A score of 100 per cent would mean a machine ran every scheduled minute, at full rate, producing nothing but good parts.
Nobody achieves that. What OEE gives you is a single figure that combines the three ways a machine loses productive time, so you can see which of the three is actually costing you and stop guessing.
The most common mistake with OEE is comparing your number with somebody else's. The calculation is sensitive to how you define scheduled time, so cross-company comparisons are close to meaningless. Compare your line against itself over time and the number becomes genuinely useful.
See it live
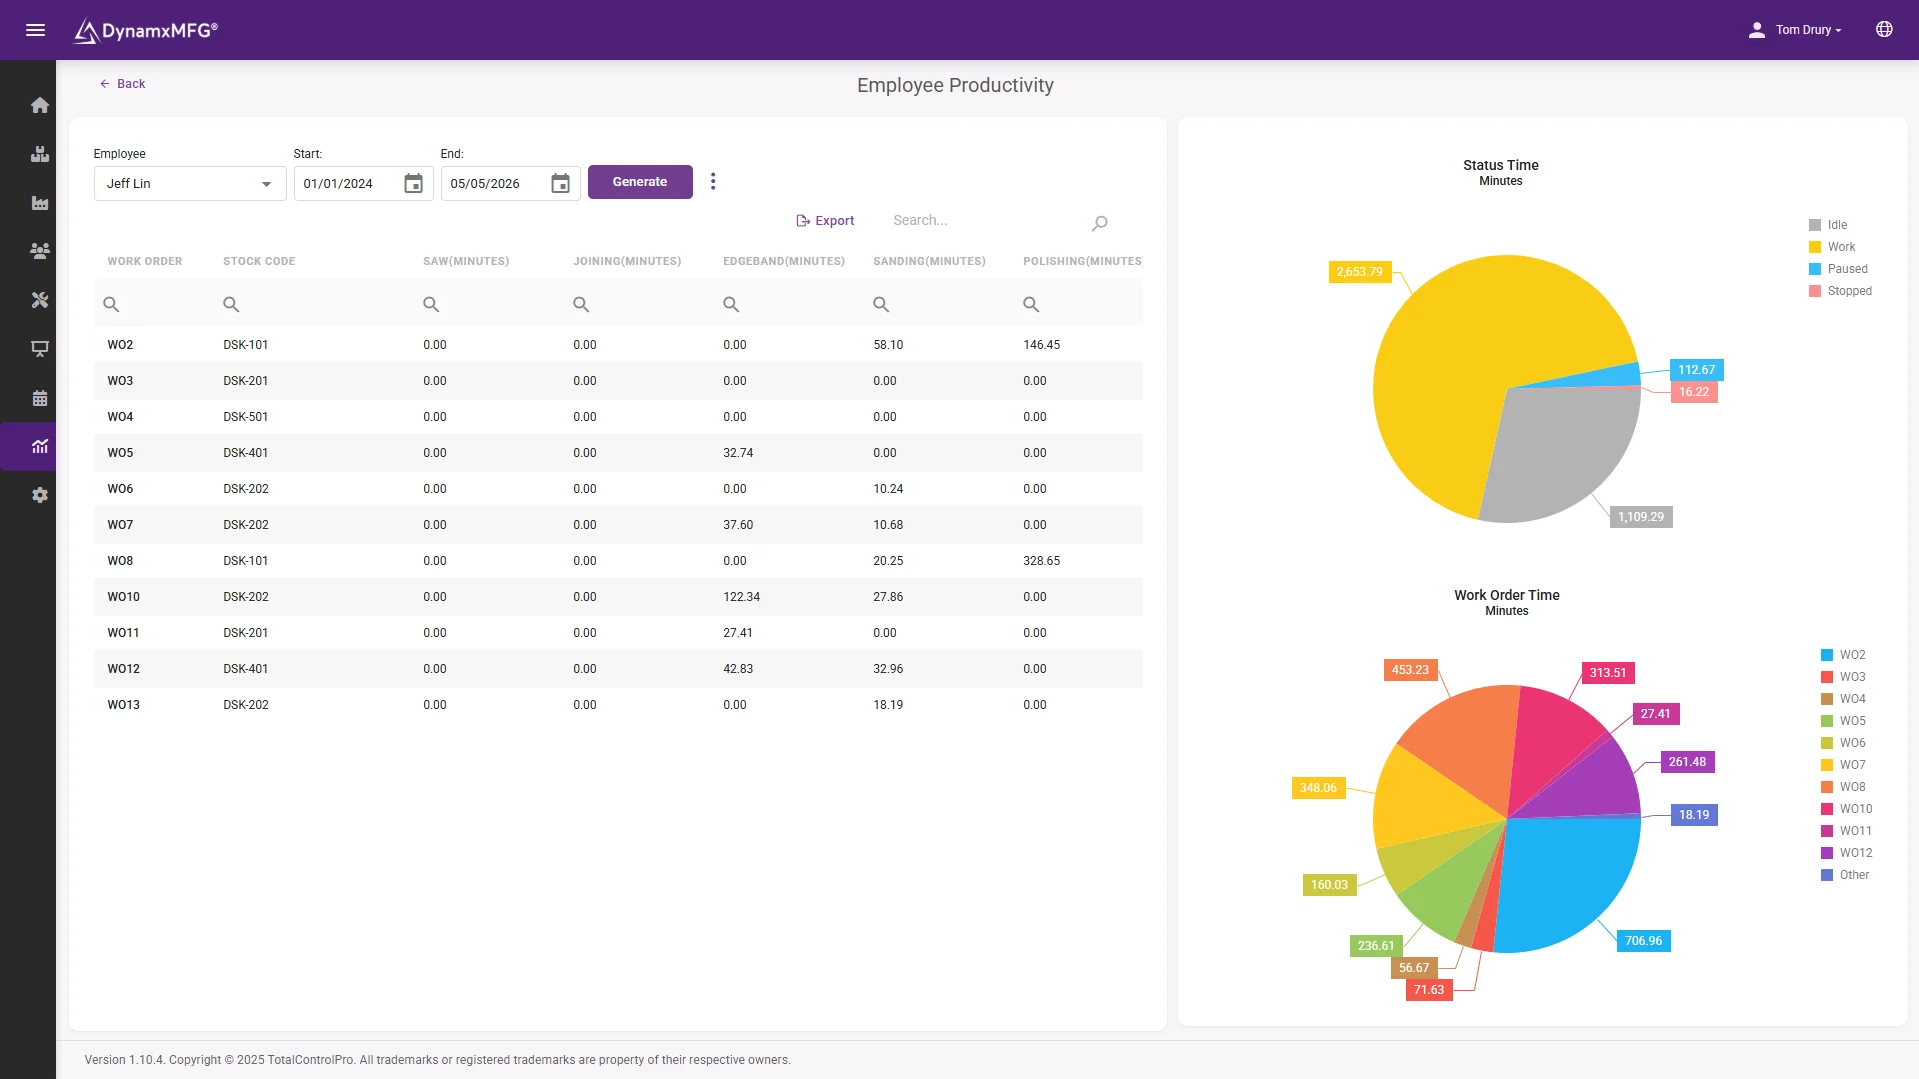
Where the machine hours actually went
Utilisation by machine and operator, from real bookings. Run time, downtime with reasons, and output against expectation, without a clipboard anywhere in the process.
The three OEE factors come apart on screen, so you can see whether availability, performance or quality is the one costing you.
- Utilisation by machine and shift
- Downtime categorised at the terminal
- The three factors shown separately
How it works
How OEE is calculated
Three ratios, multiplied. Each one answers a different question about where the time went.
Availability
Run time divided by scheduled time. Losses here are breakdowns, changeovers, waiting for material and waiting for an operator.
Performance
Actual output rate divided by the ideal rate. Losses here are small stops, reduced speed running and the machine simply not being pushed.
Quality
Good parts divided by total parts produced. Losses here are scrap and anything requiring rework.
Multiply them
85 per cent availability, 90 per cent performance and 98 per cent quality gives roughly 75 per cent OEE. Because they multiply, a weak factor drags everything down.
Capabilities
What OEE software gives you
The three factors separately
The headline number is useless without knowing which factor is dragging it.
Downtime reasons
Categorised stoppages, so the biggest recurring cause is obvious.
Trend over time
Whether it is improving, which matters far more than the absolute value.
By machine and shift
Where the differences are, which is usually where the cause is.
Changeover analysis
How much of your availability loss is setup, and on which products.
Scrap contribution
The quality factor tied to the jobs and materials producing the scrap.
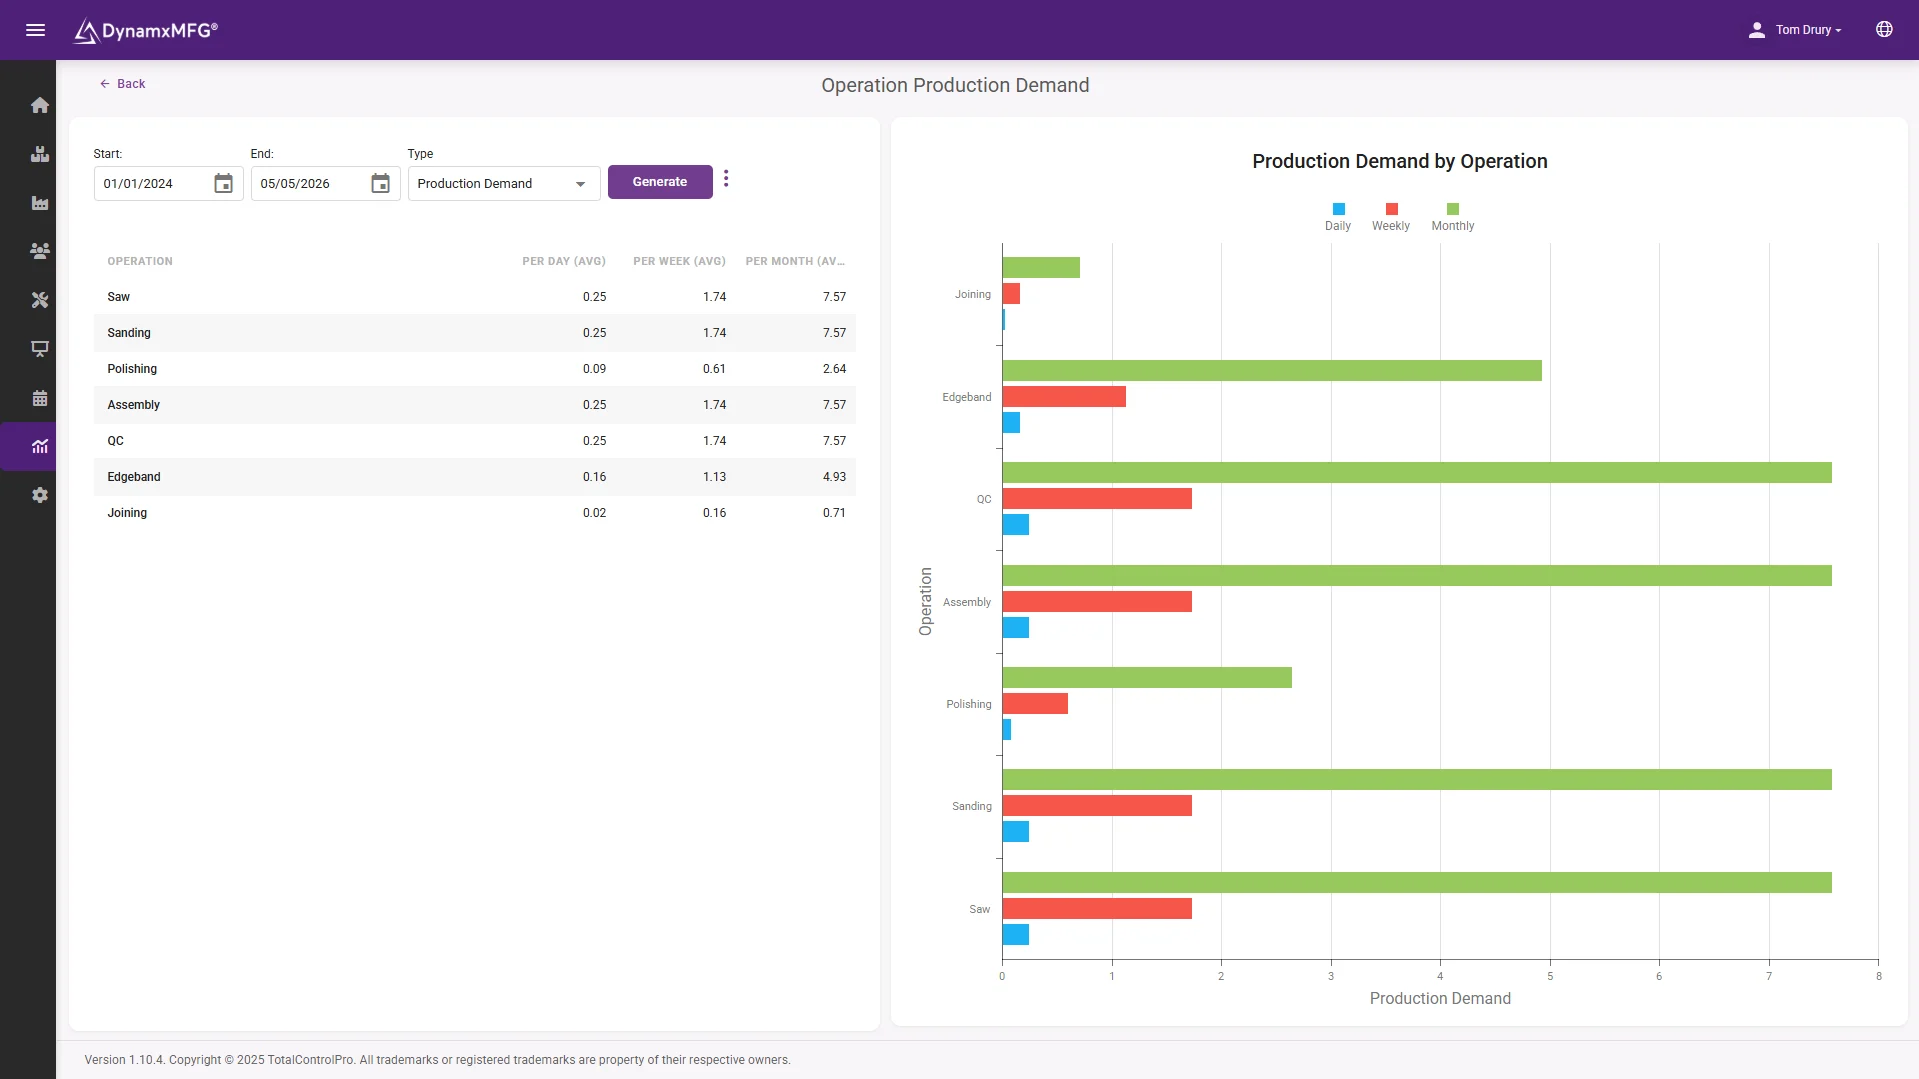
The trend
Is it getting better, and is it the constraint
OEE only means something as a trend against your own baseline. The demand and performance reports put the trend next to the load, so improvement lands where it increases output.
Ten points recovered on the bottleneck is capacity you did not have to buy.
- Trend by machine over time
- Load and OEE side by side
- Constraint improvement prioritised
Benefits
What measuring OEE changes
OEE does not improve anything by itself. It tells you which improvement is worth making, which is normally the harder question.
Effort goes where it counts
Most factories guess wrong about their biggest loss. Measuring usually reveals that small stops or changeovers cost more than the breakdowns everyone talks about.
Capital decisions get evidence
A machine at genuine 45 per cent OEE does not need replacing, it needs its losses addressed. That distinction can save the cost of a machine.
Improvement becomes visible
Changes to setup routines or maintenance show up in the trend, which is what keeps improvement programmes alive past the first month.
Bottleneck capacity increases
Recovering ten points of OEE on the constraint increases what the whole factory can ship, without buying anything.
Reading the number
What OEE tells you and what it does not
OEE is widely misused. Being clear about its limits makes it far more useful.
| OEE is good for | OEE is bad for | |
|---|---|---|
| Purpose | Tracking one resource against itself over time | Comparing your factory to another company |
| Scope | Machine-constrained, repetitive production | High-mix job shops where every job differs |
| Insight | Which of three loss types dominates | Whether the factory as a whole is efficient |
| Behaviour | Focusing improvement on the constraint | Chasing utilisation on non-bottleneck machines |
| Risk | Manageable when the three factors are shown | Gaming, when only the headline is reported |
| Alternative | Use alongside throughput and delivery performance | Do not use it as the single factory KPI |
Right for you?
When OEE is worth measuring
OEE earns its keep in machine-constrained environments. In labour-constrained job shops other measures usually matter more.
- A specific machine or cell is clearly the constraint on what you can ship.
- You have capital equipment whose utilisation drives your cost base.
- Changeover and setup time is significant and nobody has quantified it.
- You are considering buying capacity and want to know whether you need it.
- Downtime is recorded informally, so the biggest recurring cause is a matter of opinion.
- You run repetitive or semi-repetitive production where an ideal cycle time is meaningful.
DynamxMFG
OEE from bookings you are already making
OEE projects usually stall on data collection. Dedicated monitoring hardware on every machine is expensive, and asking supervisors to log downtime on a clipboard produces numbers nobody believes.
DynamxMFG derives the three factors from what the shop floor already books: run time against scheduled time, quantity produced against expected rate, and good parts against total. Where machines can report automatically, that data feeds in too.
Built from real bookings
Run time, quantity and scrap from the operation. See shop floor data capture.
Downtime with reasons
Stoppages categorised at the terminal. See resources and workforce.
Trends and comparison
By machine, shift and product in manufacturing intelligence.
Integrations
Connects to what you already run
OEE data earns its keep in the monthly pack and the capex case. DynamxMFG exports to Excel and Power BI, so the numbers land in the format your board already reads.
See all 33 integrations →













Customers
What manufacturers say about DynamxMFG
“DynamxMFG is an excellent choice for manufacturers looking to digitise operations without being overwhelmed by complexity.”
“As GMC has grown, it had become harder for me to have such a keen view on components to see if those parts were profitable or not. DynamxMFG enabled us to monitor the machine time and see whether we are making a profit or a loss on each component.”
“The ability to dynamically modify BOMs after release, adding or removing items from work orders, scrapping and reworking parts, has been the single biggest improvement for our business.”
“We chose the system over competitors because of its ease of use, strong customer support and friendly delivery team. So far, everything has matched what was promised.”
“With DynamxMFG, all our production processes are tracked and the relevant data is captured. This increases our control over the business and helps us identify more opportunities to enhance efficiency and quality.”
“Our experience has been positive, and it was definitely worth switching. The support we have received has been extremely helpful. My favourite feature is the integration and automation capabilities.”
Questions
OEE questions, answered
What is a good OEE score?
85 per cent is widely quoted as world class for discrete manufacturing, and most factories measuring honestly for the first time land between 40 and 60. The trend matters far more than the absolute figure.
Should planned downtime count against availability?
That depends on your definition of scheduled time, and it is the main reason OEE figures are not comparable between companies. Pick a definition, write it down and never change it.
Do we need machine monitoring hardware?
Not to start. Operator bookings give you a usable OEE. Automated capture improves precision and removes effort, and is worth adding on your constraint first.
Is OEE useful in a job shop?
Less so. OEE assumes a meaningful ideal cycle time, which is hard where every job is different. Job shops usually get more from job costing and delivery performance.
Why does my OEE drop when I start measuring properly?
Because the earlier number was wrong. Honest measurement almost always produces a lower figure than the estimate it replaces, and that is the point at which it becomes useful.
Should we measure OEE on every machine?
No. Measure the constraint. Improving OEE on a machine that is not the bottleneck adds cost and no output.
Related reading
Read next
Background reading on OEE software from the DynamxMFG glossary and blog.
Find out where your machine time goes
Book a 30 minute call and we will break your constraint machine into availability, performance and quality using real bookings.


