
Reporting
Manufacturing reporting software
Get delivery performance, job profitability, scrap and utilisation out of the system automatically, instead of somebody building the same spreadsheet every month.
Definition
What is manufacturing reporting software?
Manufacturing reporting software turns captured production data into the figures a business actually runs on: on-time delivery, job and product profitability, scrap and rework, machine and labour utilisation, and throughput against plan.
The distinction from real-time production tracking is purpose. Tracking is for intervening today. Reporting is for deciding what to change, which customers to keep, what to quote and where to invest, and those decisions are made on trends rather than moments.
Almost every manufacturer already produces reports. The question is what they cost. If a number takes somebody two days a month to compile, you are paying twenty-four days a year for information that was already in the business.
See it live
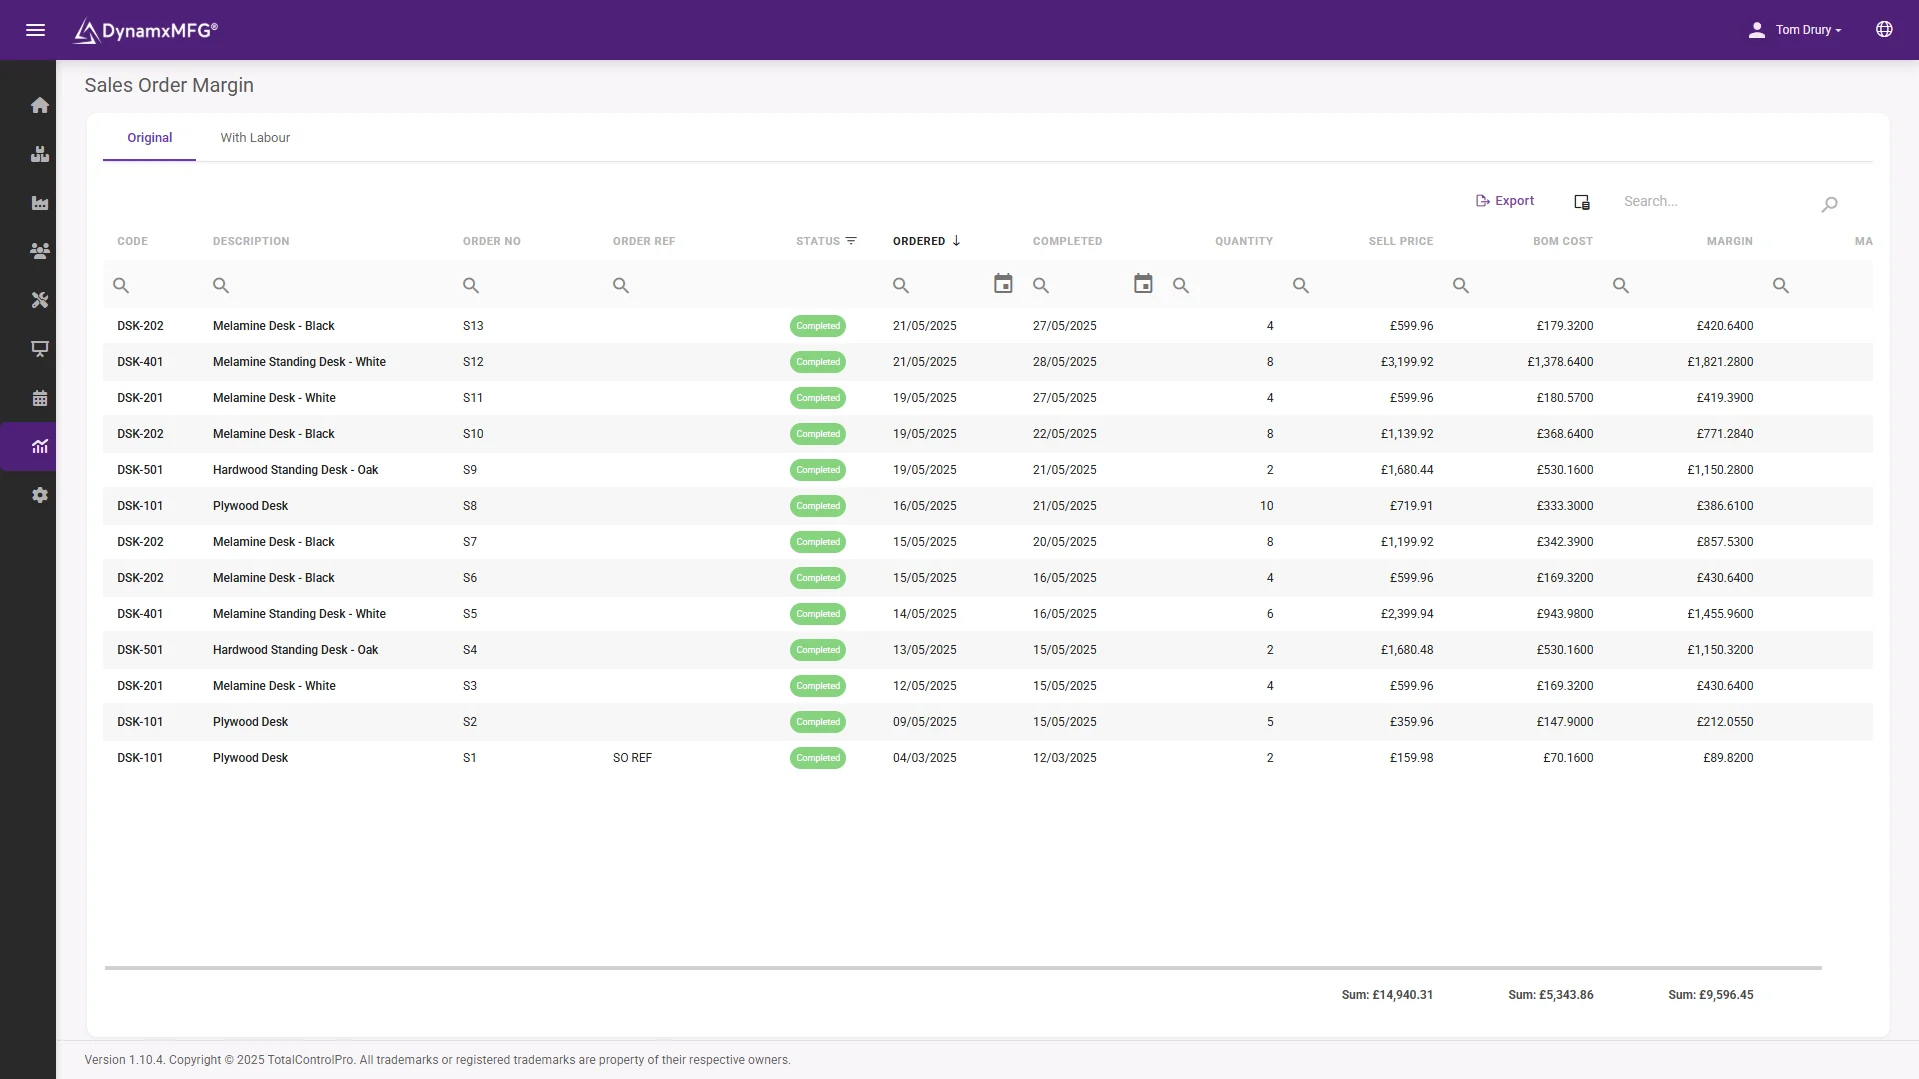
The margin report that ends arguments
Sales order margin from real booked hours and issued material, by job, product and customer. One source, one version, no Friday afternoon spreadsheet.
Drill from any figure to the works orders behind it, because a number you can open is a number you can trust.
- Margin by job, product and customer
- Drill-through to the underlying jobs
- No manual compilation anywhere
How it works
How manufacturing reporting works
Good reporting is mostly a consequence of good capture. The analysis is the easy half.
Capture once at source
Every report is built from the same bookings operators already make. Nothing is entered a second time for reporting purposes.
Aggregate consistently
Figures roll up by job, product, customer, work centre, operator and period from one dataset, so two reports cannot disagree.
Deliver without asking
Standard packs are produced on a schedule rather than requested, so the monthly review starts with numbers rather than waiting for them.
Drill back to the job
Any figure can be opened up to the jobs behind it, which is what turns a report from a statement into an investigation.
Capabilities
What you get out
On-time delivery
Promised against actual despatch, by customer and by product.
Job and product profitability
Actual cost against quoted, aggregated to show which work pays.
Scrap and rework
Cost and rate, broken down by product, machine, material and shift.
Utilisation
Machine and labour hours used against hours available.
Throughput
Output by period against plan, with the constraint identified.
Export anywhere
To Excel, Power BI or your accounts package rather than trapped in one screen.
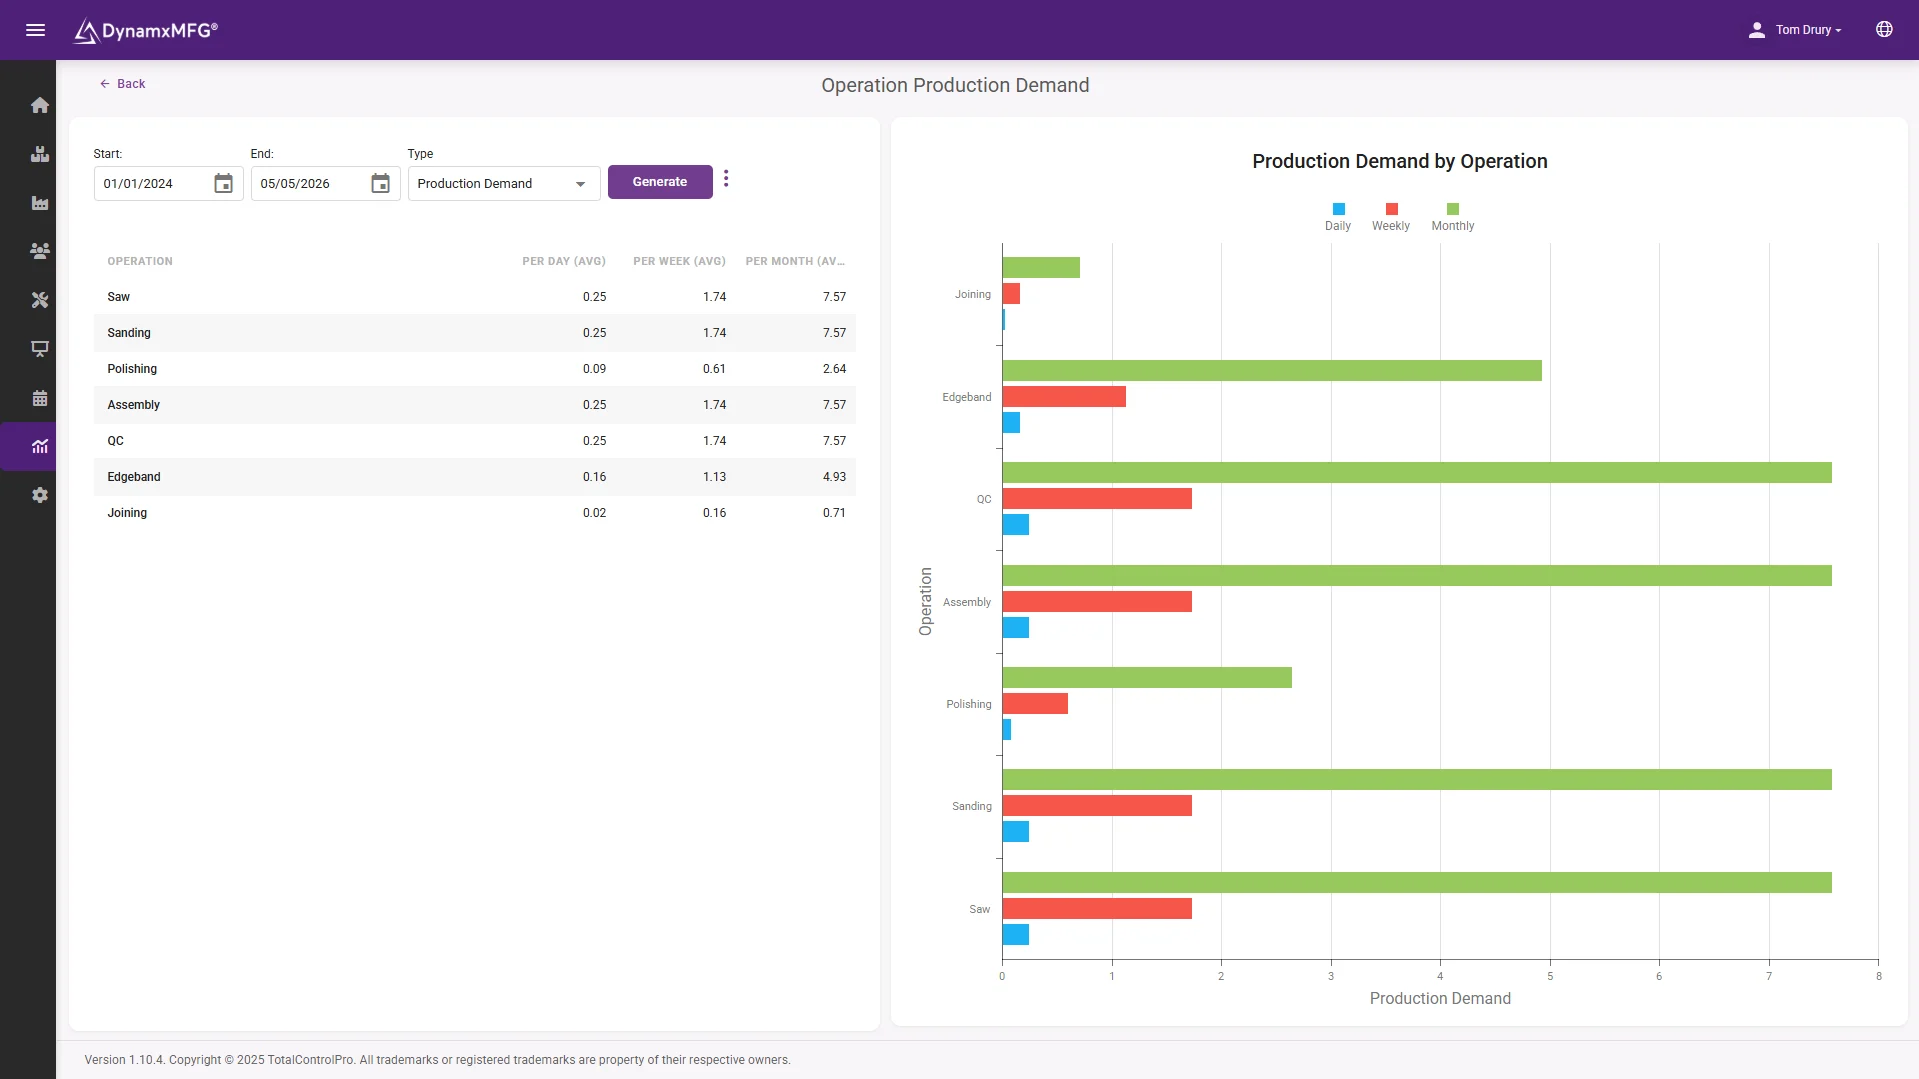
The forward view
Reports that look ahead, not just back
The production demand report shows what is coming at each work centre, so the pack answers next week as well as last month.
Over 40 built-in reports run from live data, scheduled and delivered rather than requested and awaited.
- Demand and load by week
- 40+ reports from live bookings
- Scheduled delivery to the people who act
Benefits
What automatic reporting changes
The saving is real but secondary. The main effect is that decisions start being made on evidence.
The monthly compile disappears
Somebody in most manufacturers spends days each month assembling numbers. That time comes back, and the numbers arrive earlier.
Arguments end faster
When everybody is looking at the same figures from the same source, meetings move from establishing what happened to deciding what to do.
Unprofitable work becomes visible
Profitability by product and customer is the report that most often changes what a manufacturer does next, and it is almost impossible to produce by hand.
Improvement gets measured
Any change to process, layout or scheduling can be checked against the trend, which is how improvement programmes survive past enthusiasm.
Reports vs dashboards
Reporting, dashboards and analytics
Three words used loosely for three genuinely different things. Knowing which you need avoids buying the wrong one.
| Reporting | Dashboards and analytics | |
|---|---|---|
| Answers | What happened over this period? | What is happening, or why did it happen? |
| Format | Structured pack, usually periodic | Live screen, or exploratory analysis |
| Audience | Board, finance, customers | Supervisors, improvement teams |
| Cadence | Weekly or monthly | Continuous, or ad hoc |
| Value | Consistency and comparability | Immediacy, or depth of insight |
| Related page | This page | Real-time tracking |
Right for you?
When you need this
The clearest sign is a spreadsheet that one person rebuilds every month and everybody depends on.
- Monthly production figures are compiled by hand from several sources.
- Two reports in the business disagree and nobody is certain which is right.
- You know overall margin but not margin by product, job or customer.
- Scrap and rework are discussed in general terms because nobody has the numbers.
- Delivery performance is measured by how many complaints you received.
- The person who builds the reports is a single point of failure.
DynamxMFG
Reports that build themselves
Reporting fails when it depends on a separate data-gathering exercise. Anything requiring somebody to collect, clean and reconcile before the analysis can start will be late, inconsistent, and eventually abandoned when that person is busy.
Because DynamxMFG captures labour, material, progress and quality as work happens, the reporting layer has nothing to assemble. Delivery performance, job profitability, scrap and utilisation come from the same bookings that ran the factory.
One dataset
Every figure from the same captured events. See manufacturing intelligence.
Drill to the job
Open any number and see the works orders behind it. See job costing.
Out to your tools
Export to Excel or Power BI rather than locking it in.
Integrations
Connects to what you already run
Your reports probably end their life in Excel or Power BI, and that is fine. DynamxMFG feeds both, plus your accounts stack, from the same live dataset.
See all 33 integrations →













Customers
What manufacturers say about DynamxMFG
“DynamxMFG is an excellent choice for manufacturers looking to digitise operations without being overwhelmed by complexity.”
“As GMC has grown, it had become harder for me to have such a keen view on components to see if those parts were profitable or not. DynamxMFG enabled us to monitor the machine time and see whether we are making a profit or a loss on each component.”
“The ability to dynamically modify BOMs after release, adding or removing items from work orders, scrapping and reworking parts, has been the single biggest improvement for our business.”
“We chose the system over competitors because of its ease of use, strong customer support and friendly delivery team. So far, everything has matched what was promised.”
“With DynamxMFG, all our production processes are tracked and the relevant data is captured. This increases our control over the business and helps us identify more opportunities to enhance efficiency and quality.”
“Our experience has been positive, and it was definitely worth switching. The support we have received has been extremely helpful. My favourite feature is the integration and automation capabilities.”
Questions
Manufacturing reporting questions, answered
Can we not just use Power BI?
Power BI is an excellent way to present manufacturing data and no help at all in collecting it. It needs a reliable source, which is the shop floor capture underneath. DynamxMFG feeds it.
What reports should a manufacturer start with?
On-time delivery and job profitability. Between them they tell you whether you are keeping promises and whether the work is worth having, which covers most early decisions.
How many KPIs should we track?
Fewer than you think. Five that people act on beat forty that nobody reads. Every measure you publish should have somebody who can influence it.
Can customers get their own reports?
Some manufacturers share delivery performance with key accounts, and it can be a genuine commercial advantage. It only works if the underlying data is reliable.
How far back should reports go?
Far enough to see seasonality, so at least a rolling year once you have it. Trends over quarters are more useful than any single month.
Does this replace our accounts reporting?
No. Accounts reporting is financial and statutory. This is operational, and it explains the numbers the accounts report. They answer to each other rather than replacing each other.
Related reading
Read next
Background reading on manufacturing reporting from the DynamxMFG glossary and blog.
Stop rebuilding the same spreadsheet
Book a 30 minute call and tell us which report costs you the most time. We will show you where it would come from.


